Hyundai Commercial Beats Acura, Starbucks beats Death Wish
Gender Roles and Favorability in Super Bowl 50 Commercials Analyzed by Spot Trender
MOUNTAIN VIEW, Calif. (February 7, 2016) – Spot Trender, an industry leader in cloud-based ad-testing technology, announced today the results of their third annual Super Bowl Ad Performance Test. Conducted for Super Bowl 50, this year’s test examined themes relating to sexuality and gender roles. The results below will also be posted on Twitter with the hashtag #WomenOfSuperBowl.
“We are delighted to see that more advertisers this year took steps to adapt their commercials to the evolving landscape surrounding gender norms,” said Rick Nguyen, president of Spot Trender. “The portrayal of women in the media is a very important issue to us at Spot Trender, which is why we decided to do our part by providing data for the discussion.”
“The ultimate question for advertisers is ‘will this ad sell products?’ – either by encouraging viewers to buy the product soon, or by affecting their long-term purchasing behavior through brand perception,” said Nguyen. “At Spot Trender, we help our clients measure, track, and improve these metrics, especially when it comes to ads with a positive message to help make society a better place.”
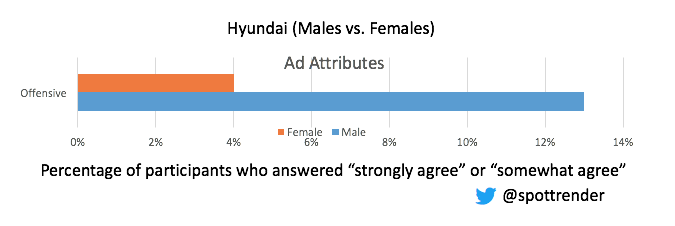
“It’s interesting to pay attention to what respondents consider offensive, especially with the Hyundai commercial, which 13 percent of male respondents found to be offensive,” said Chris South, CEO of Spot Trender. “This is most likely a testament to the changing societal norms about gender roles, where more and more we are seeing nontraditional roles in the home and workplace. Marketers should be aware of this shift and take it into account when launching new campaigns.
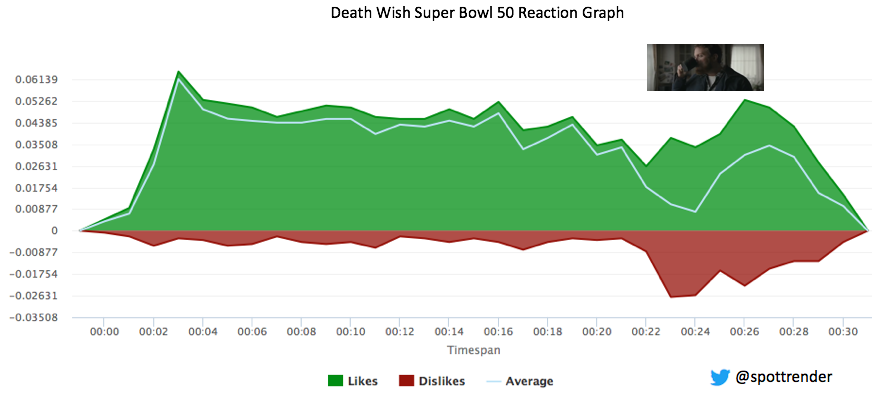
“When it comes to the Death Wish Coffee commercial, we are not so surprised that screaming Vikings didn’t perform as well with female respondents, nor are we by any means shocked that Starbucks outperformed such a lesser-known brand,” said South. “However, while male respondents liked the ad and thought it was funny, they were no more likely to purchase Death Wish than Starbucks.”
On February 4, Spot Trender conducted a scientific poll with 1301 participants in a national representative sample. Each participant saw one commercial and completed an online questionnaire through Spot Trender’s platform. There were a minimum of 300 qualified respondents for each video. Fielding took two hours to complete.
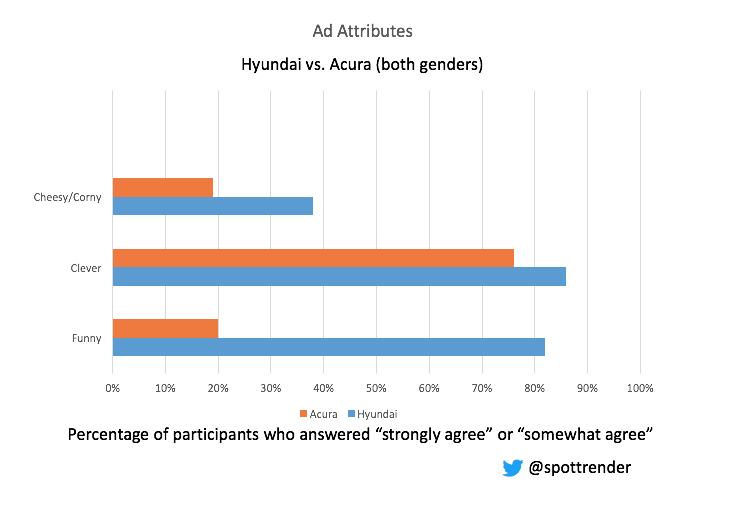
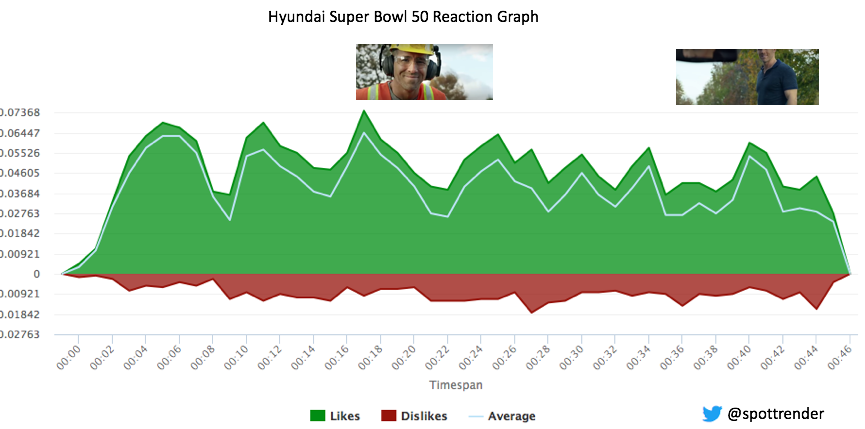
Hyundai vs. Acura: Examination of gender role reversal in advertising
-
- Research Questions: Were the jokes funny? Were viewers offended?
- Conclusion: Hyundai was very funny and clever to both female and male participants, but slightly more offensive to males.
Survey Results
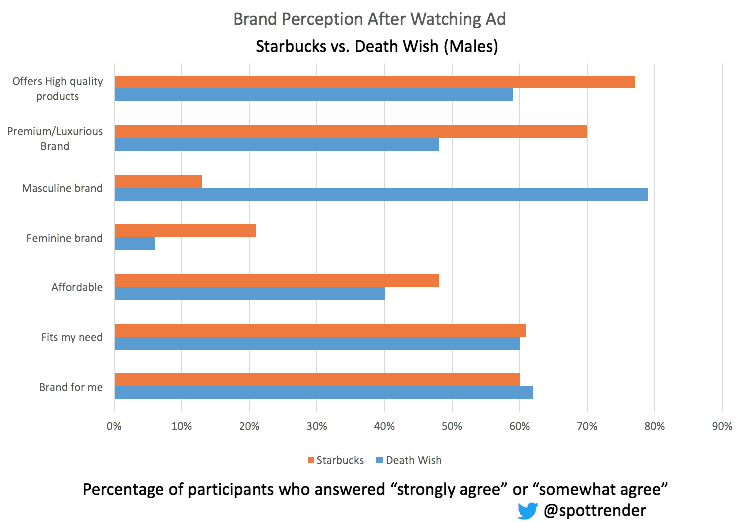
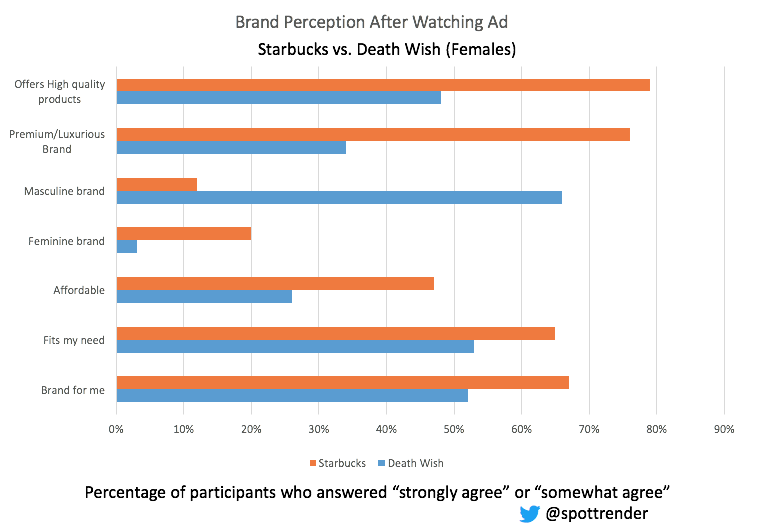
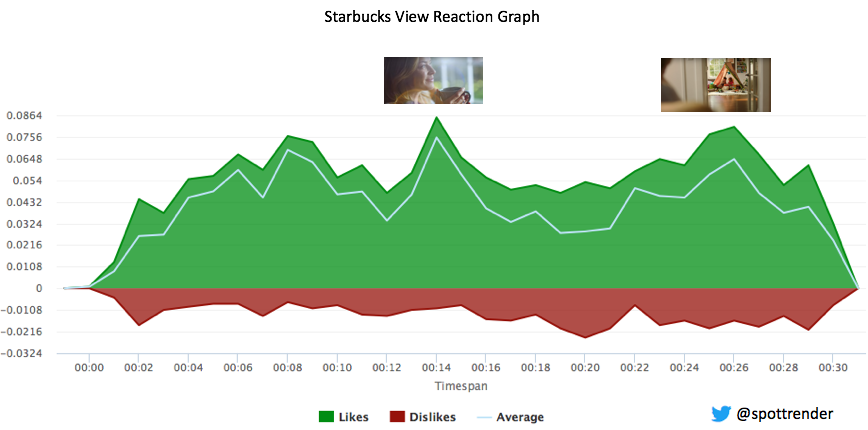
Starbucks Coffee vs. Death Wish Coffee: Examination of masculinity in advertising
- Research Question: Does having a masculine brand help Death Wish sell more products compared to the more gender neutral Starbucks brand?
- Conclusion: After seeing the ad, Starbucks brand performed better than Death Wish among males, and much better among females. While slightly more males said that they were more likely to purchase Death Wish, the difference wasn’t statistically significant (at 95% Confidence Level). Simply put, males were no more likely to purchase Death Wish vs. Starbucks after seeing the ad.
Survey Results

Questions? Comments? Please contact us.
With more than 45 million worldwide participants, Spot Trender is well known in the industry for both boasting one of the world’s largest participant pools and outperforming traditional ad-testing methods. Their current platform produces ad performance results in as soon as three hours, beating the status quo of more than three weeks, providing firms with greater flexibility with quick decision-making regarding advertising at any point during the production process.
Spot Trender’s analysis last year included competition among brands like GoDaddy and Squarespace, revealing the points in each company’s commercials to which consumers reacted positively or negatively. Click here to see Spot Trender’s complete analysis from Super Bowl XLVIII.
Additional Data
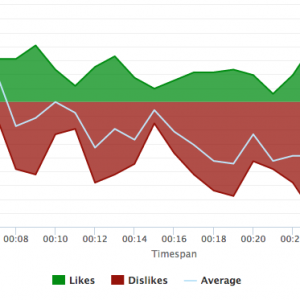
Reaction Graphs
As participants watch the video, they used the up and down keys on the keyboard to indicate whether they liked or disliked what they are watching. Spot Trender generated the reaction graphs by normalizing it with the number of participants. How the Y-axis is calculated at every second:
Green line (likes) = total ups /number of participants
Red line (dislikes) = total downs/number of participants
Average (light blue line) = (total ups – total downs)/number of participants
For example, If 100 participants who voted 15 ups and 5 downs at 5 second, the Y-axis at 5s would be (15-5)/100 = .1
About Spot Trender
Spot Trender is an advertising technology platform that helps brands and agencies predict the impact and persuasiveness of their TV, online, and radio advertisements from creative concepts to post production. Contact us to learn how we can help you.